Company type: Energy Resouce | Core requirements: Map View + Data Report
SP PowerGrid, a member of Singapore Power Group, manages Singapore’s electricity and gas transmission and distribution networks. It uses cutting-edge technology to deliver highly reliable and efficient energy supply to industrial, commercial and residential customers.SP PowerGrid is the management company of SP PowerAssets Ltd and PowerGas Ltd. PowerGas is the sole licensed gas transporter and gas system operator in Singapore, delivering both natural gas and town gas.
PowerGas owns the gas transmission and distribution networks in Singapore which include two onshore receiving facilities for natural gas from Sumatra and Malaysia, and 2,900 km of underground pipelines. It continues to enhance its network infrastructure to support Singapore’s future gas needs and economic growth. Pipeline infrastructure is decaying at an accelerating rate due to reduced funding, insufficient quality control resulting in poor installation, little or no inspection and maintenance, and a general lack of uniformity and improvement in design, construction and operation practices, among other things. It is in the interest of any gas company to maintain the value of its pipelines and to protect them effectively against damage caused by aging of the pipeline.
Developing an intelligent system can provide fast and reliable decision-making tools that are needed to handle the large volume of deteriorating buried pipeline infrastructure systems, particularly gas pipelines, that pose serious threats to environment if they fail. The focus of it is to develop customized state-of-the-art software for pipeline condition monitoring system, and utilization of the data for an intelligent renewal of pipeline infrastructure. Such a system could automate in interpretation and evaluation process, and capture the experience and judgment of expert utility engineers in performing condition assessment and identification of appropriate rehabilitation and maintenance strategies..As a result of global progress in high-resolution remote sensing and GIS technology, it is now possible to design gas pipeline condition monitoring systems with sensing data and GIS based processing software. The Pipeline Integrity & Condition Monitoring System will provide:
The PICMS provide by MGINNO helps SP PowerGrid to monitor the pipline integrity & conditions and make maintenance plans according the below functions
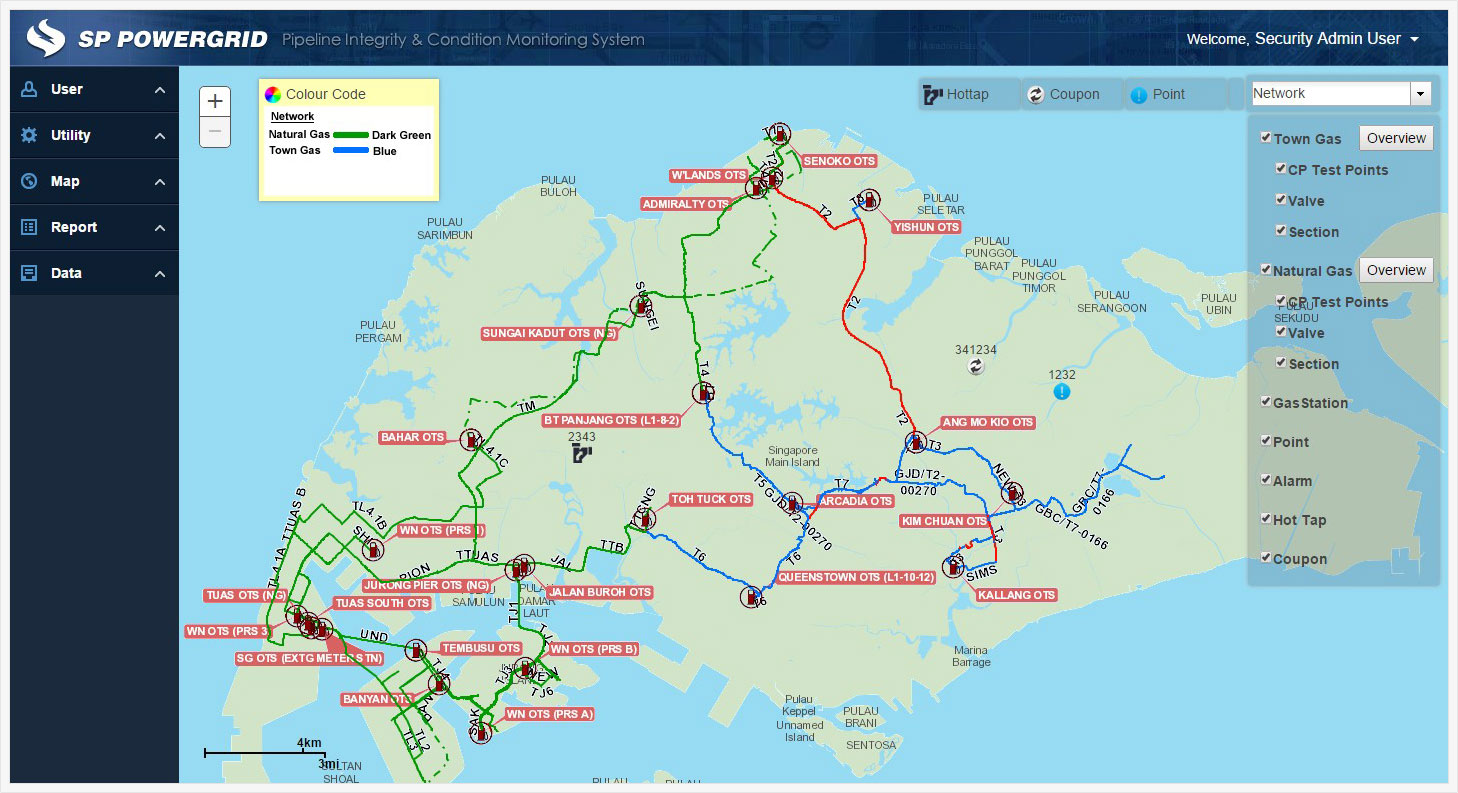
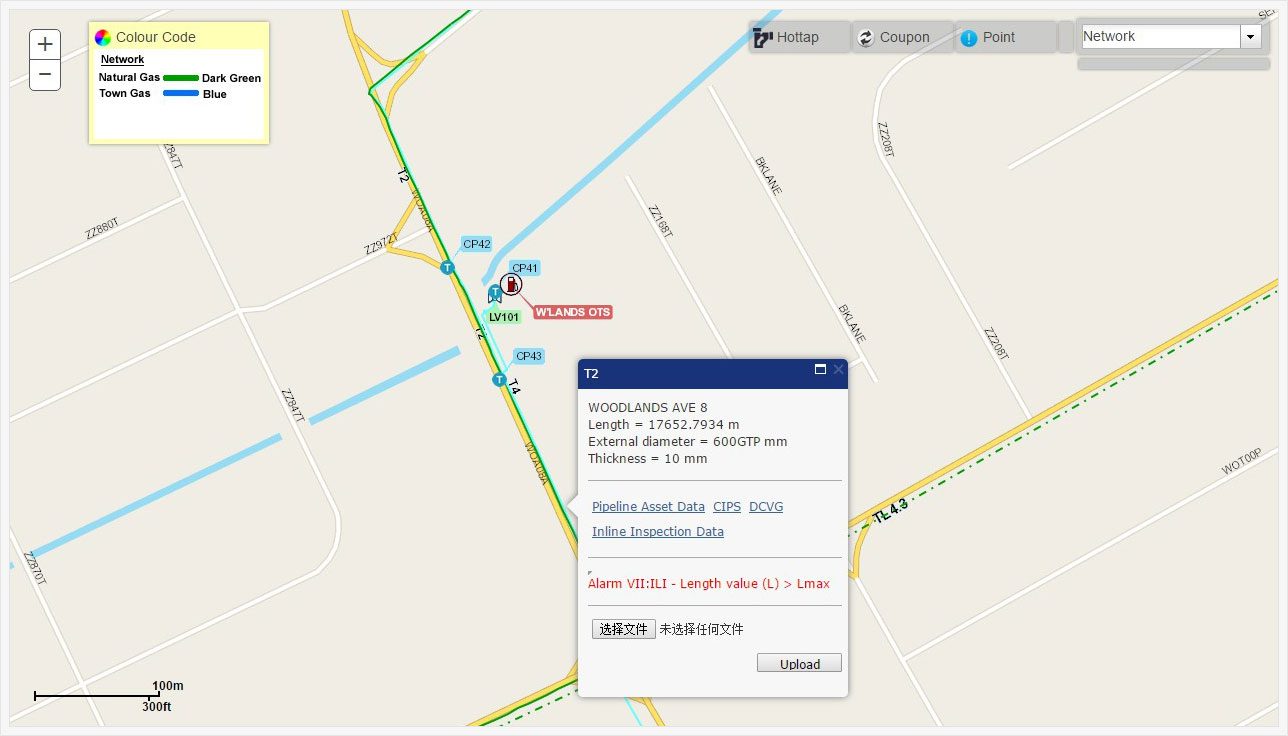
Display the Pipeline infrastructure infomation on the map
PICMS displays data on geographicalmaps. Including geo-referenced pipeline data,inspection data and risk assessments results. Integrate functionality like spatial queries, measurement functionalities and visualization of detailed object information. Provide a tool for uploading documents into the different assets found in a geo-spatial environment.
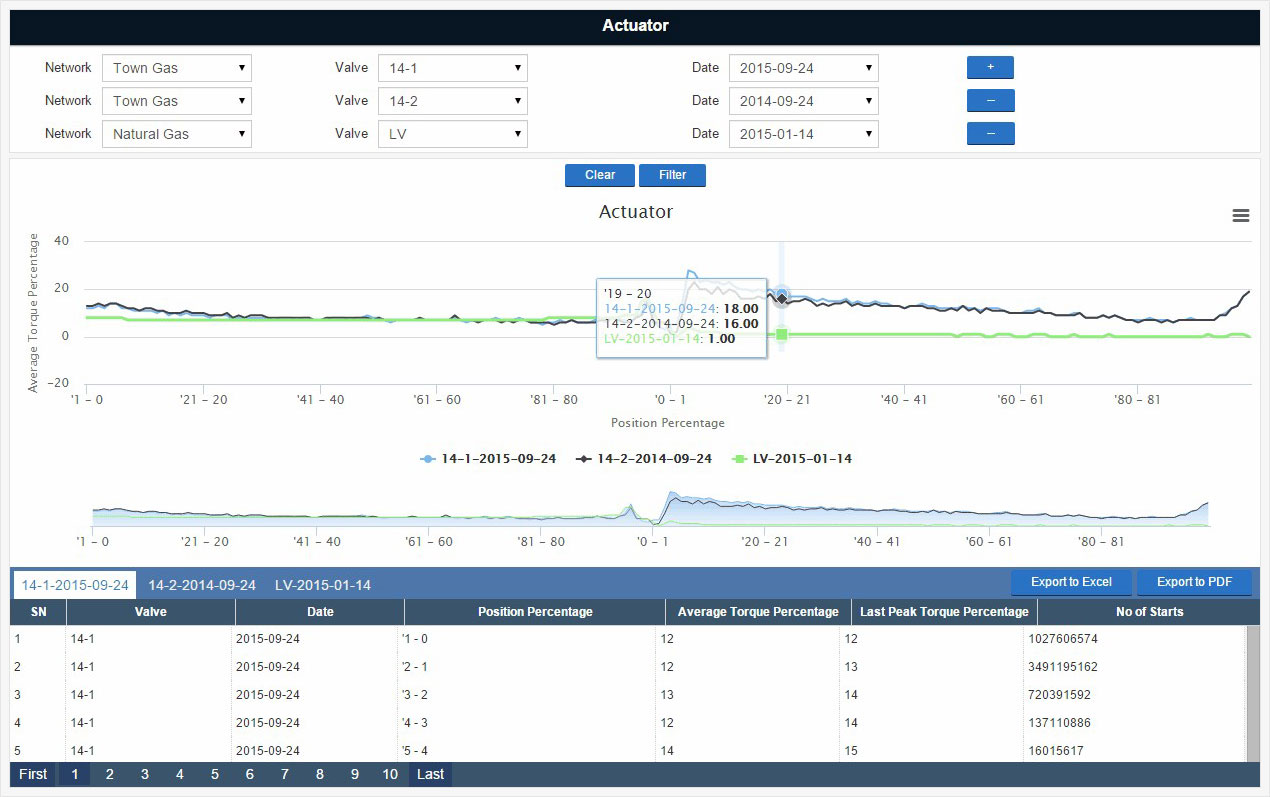
Generate the pipeline reports and compare the data on a graph
According to the reports of the pipelines, PICMS is able to evaluate the lifetime, and at the meanwhile, make an inspection plan.